
WGU Applied Algebra FXO2 PFXP C957 (Applied-Algebra) Free Practice Test
Question 1
A researcher collected data on the traffic frequency on a section of road. The results are shown in the scatterplot. A regression function is graphed with r^2=0.96. The predicted traffic frequency 16.2 hours after dawn is 70 cars per minute.

Is this prediction appropriate?
Is this prediction appropriate?
Correct Answer: B
Explanation: Only visible for TestSimulate members. You can sign-up / login (it's free).
Question 2
The number of registered voters in a district is modeled by a decreasing exponential function, where x represents the number of years since 2005 and f(x) represents the number of registered voters.
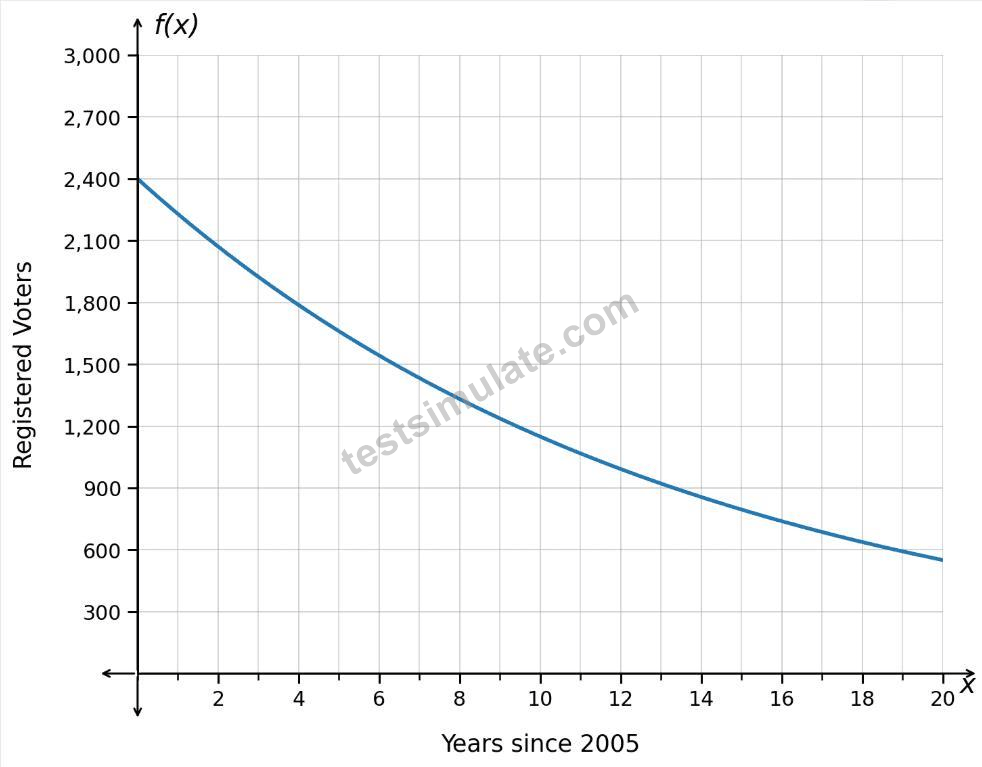
Which interval is associated with the slowest average decrease in the number of registered voters?
Which interval is associated with the slowest average decrease in the number of registered voters?
Correct Answer: D
Explanation: Only visible for TestSimulate members. You can sign-up / login (it's free).
Question 3
Consider the function
w(t)=0.03t^4-0.81t^3+7.55t^2-26.62t+44
which represents the number of workers, w, at a job site thours after 6:00 a.m.
What is the difference between w(4)and w(8)?
w(t)=0.03t^4-0.81t^3+7.55t^2-26.62t+44
which represents the number of workers, w, at a job site thours after 6:00 a.m.
What is the difference between w(4)and w(8)?
Correct Answer: C
Explanation: Only visible for TestSimulate members. You can sign-up / login (it's free).
Question 4
The graph shows the value, O, in dollars, of an investment account over time.
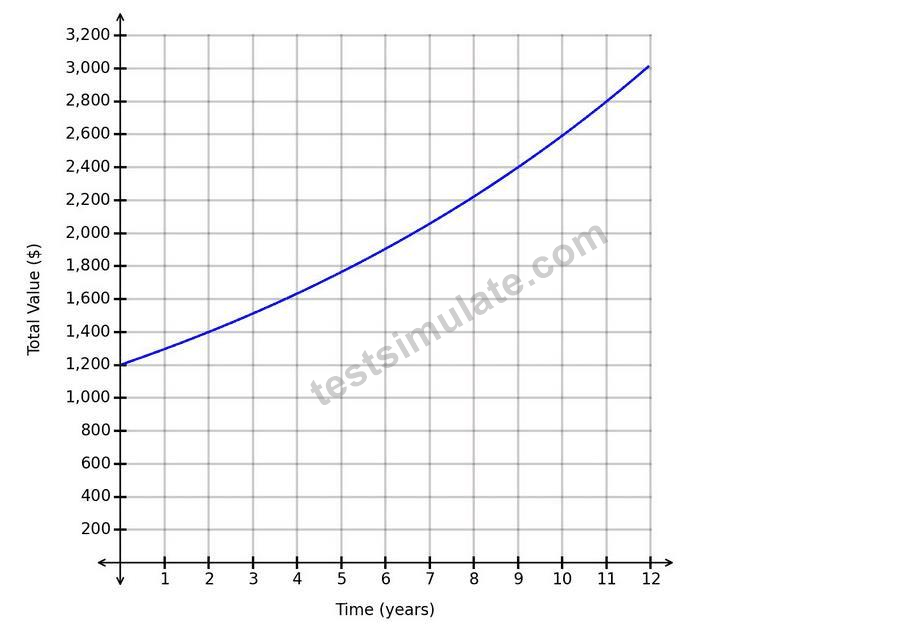
What represents the value of the account after 8 years?
What represents the value of the account after 8 years?
Correct Answer: C
Explanation: Only visible for TestSimulate members. You can sign-up / login (it's free).
Question 5
The number of property sales in a region this year is expected to be 6 less than the number of property sales in the region last year. The function H(x)represents the number of property sales this year, where xrepresents the number of properties sold last year.
Which notation represents the number of property sales this year, given that the number of properties sold last year was 330?
Which notation represents the number of property sales this year, given that the number of properties sold last year was 330?
Correct Answer: C
Explanation: Only visible for TestSimulate members. You can sign-up / login (it's free).
Question 6
The weekly number of players, P, in hundreds, on a gaming website is modeled by the graph. The horizontal axis shows the number of years since the website was launched.
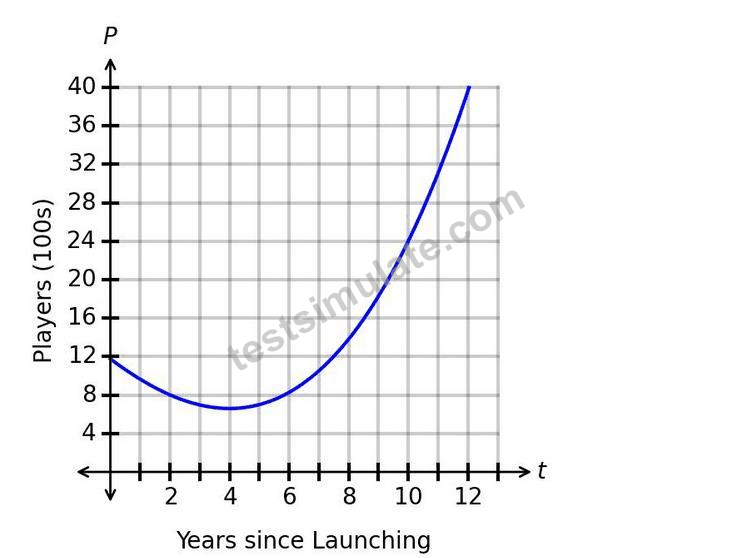
When did the website reach the minimum weekly number of players?
When did the website reach the minimum weekly number of players?
Correct Answer: B
Explanation: Only visible for TestSimulate members. You can sign-up / login (it's free).
Question 7
The value of a collectible coin can be modeled by F(t), where t represents years since the number of years since the coin was found, and the vertical axis represents the value, in thousands of dollars.
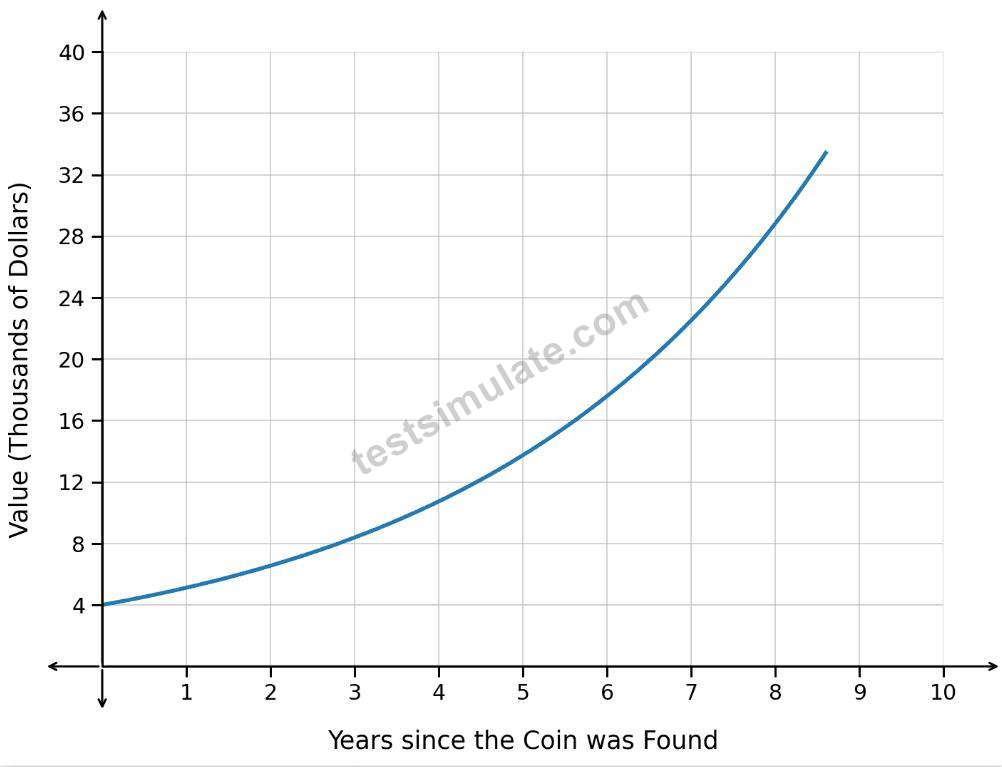
How is the value of the coin changing over time based on the graph?
How is the value of the coin changing over time based on the graph?
Correct Answer: B
Explanation: Only visible for TestSimulate members. You can sign-up / login (it's free).
Question 8
The scatterplot shows data on the population of rabbits in a nature preserve. The graphed regression function has an r^2value of 0.94.

What is the appropriate range of x-values for extrapolation?
What is the appropriate range of x-values for extrapolation?
Correct Answer: D
Explanation: Only visible for TestSimulate members. You can sign-up / login (it's free).
Question 9
The population of fish in a lake is changing according to the function
P(t)=24t+185
where tis the number of months since the beginning of the year and P(t)is the fish population at time t.
Which interpretation of the rate of change is correct?
P(t)=24t+185
where tis the number of months since the beginning of the year and P(t)is the fish population at time t.
Which interpretation of the rate of change is correct?
Correct Answer: A
Question 10
The function P(t) represents the yearly profit, in millions of dollars, for a clothing store since opening. The graph of P(t) is shown.

How should the maximum value be interpreted?
How should the maximum value be interpreted?
Correct Answer: C
Explanation: Only visible for TestSimulate members. You can sign-up / login (it's free).